

Where Does Energy Go in a Battery Storage System?
Time : Oct 26, 2026 View : 355
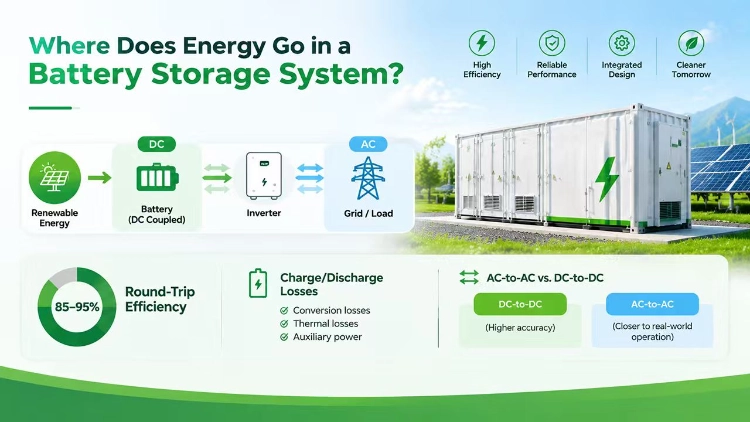
A battery storage system can take in a measured amount of electricity and return less energy later. The difference is not explained by the battery cells alone. Power conversion, wiring, temperature control, monitoring equipment, and the length of time a system remains idle can all affect the energy delivered to the load.
Battery round-trip efficiency (RTE) describes the relationship between energy returned and energy used to charge the system over a defined cycle. The percentage is useful only when input and output are measured at clearly stated points. A cell-level result and a complete system’s AC-to-AC result answer different questions.
What Is Battery Round-Trip Efficiency?
Round-trip efficiency is the energy discharged divided by the energy charged, multiplied by 100%. For a system measured at its AC connection, the input is the AC electricity used to charge it and the output is the AC electricity returned after discharge. For a DC-to-DC test, both measurements are taken on the DC side.
The measurement boundary changes what the number includes. A battery-only test may exclude the inverter, transformer, cooling, and control loads. An AC-to-AC system test may include some or all of them, depending on the test method and meter placement. Two efficiency percentages cannot be compared fairly until those conditions are known.
RTE is also different from usable capacity. Capacity describes how much energy is available within a defined operating window; efficiency describes how much of the energy put into a cycle comes back out. These measures are related, but they should not be treated as interchangeable.
Where Does Energy Go During a Storage Cycle?
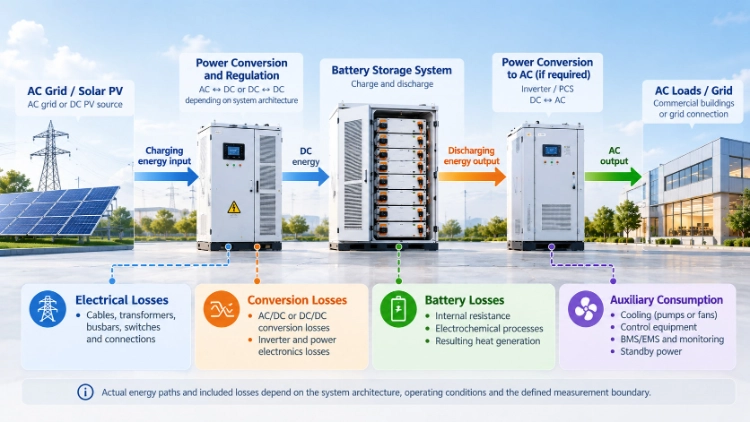
Energy losses occur at several points between the incoming supply and the final load. The share attributable to each component depends on system design, operating power, temperature, and control strategy.
Losses Inside the Battery
During charging and discharging, current passes through cells with internal resistance. Some electrical energy becomes heat instead of remaining available for later discharge. The amount changes with current, cell temperature, battery condition, and the permitted state-of-charge range.
Cell-level test results describe performance under their specific test conditions, not the performance of every cabinet or installation.
Power Conversion and Electrical Equipment
A power conversion system (PCS) changes energy between DC and AC. In a DC-coupled system, DC/DC stages may also regulate voltage between the PV array, battery, and inverter. Transformers, cables, busbars, switches, and protection devices introduce additional losses as current flows.
Conversion efficiency is not a fixed value at every power level. A converter may operate differently at light load than near its rated output. A PCS peak-efficiency figure should therefore not be used as the round-trip efficiency of the complete battery energy storage system (BESS).
Cooling, Controls, and Standby Consumption
A storage cabinet may use power for pumps, fans, controllers, communications, sensors, and other auxiliary equipment. Liquid-cooled systems need energy to run their thermal-control equipment; air-cooled systems also use energy for fans and related controls. The actual draw depends on the design and operating conditions.
These loads consume electricity without adding energy to the battery’s usable reserve. Their effect can become more noticeable when a system handles a small amount of energy or remains in standby for a long interval. Whether auxiliary power is included in the published RTE must be checked rather than assumed.
Why Does AC-to-AC Efficiency Differ From DC-to-DC Efficiency?
The terms describe where energy is measured. DC-to-DC efficiency measures energy entering and leaving a battery-side DC boundary. AC-to-AC efficiency measures system AC input and AC output, so it can capture losses in the PCS and other equipment between those points.
A battery may show a certain DC-side efficiency while the installed system returns a lower AC-side percentage. That difference does not automatically indicate a faulty battery. It may reflect inverter conversion, transformer losses, auxiliary consumption, or a longer test window.
AC-coupled and DC-coupled systems can also have different energy paths. In an AC-coupled arrangement, solar electricity may pass through a PV inverter before a battery PCS converts it back to DC. A DC-coupled architecture may avoid that particular conversion sequence when charging from PV. However, the final result depends on the actual components and operating conditions; the architecture alone does not establish a universal efficiency winner.
How Do You Calculate Battery Energy Losses?
Use input and output energy measured over the same cycle and at the same defined boundary.
Round-trip efficiency = energy output ÷ energy input × 100%
Consider an illustrative AC-side test:
|
Measurement |
Example value |
|
AC energy used to charge the system |
100 kWh |
|
AC energy returned after discharge |
88 kWh |
|
Energy difference |
12 kWh |
|
Calculated AC-to-AC RTE |
88% |
The calculation is 88 kWh ÷ 100 kWh × 100% = 88%. The 12 kWh difference represents energy not returned across that measurement boundary during the test. It should not all be assigned to battery-cell heat without separate measurements.
This example explains the formula and is not a performance claim for any Sunway product. A real test should record charging and discharging power over time, define the start and end state of charge, and document whether auxiliary loads and the transformer are inside the boundary.
Does the Time Between Charging and Discharging Matter?
Yes. If a battery is charged and discharged soon afterward, the test may capture fewer standby hours than a test that leaves the system waiting between the two events. Controls, cooling equipment, and communications may continue to draw power during that interval.
Battery self-discharge and auxiliary consumption are related to the same overall energy balance but are not the same thing. Self-discharge refers to energy lost within the battery while stored. Auxiliary consumption is electricity used by system equipment. A test should state whether both are included and how long the storage period lasts.
A short laboratory cycle may therefore return a different net result from a schedule that includes overnight standby. Buyers should check the test duration before comparing efficiency figures.
Why Can Efficiency Change at Different Operating Powers?
The battery and its converters do not operate in exactly the same way at every power level. Higher current can increase resistive losses, while power electronics may be less efficient at some partial-load points. Cooling demand may also change with temperature and duty cycle.
The permitted SOC window affects how much energy is charged and discharged during a cycle. A test that starts and ends at different SOC levels may not represent a complete, comparable round trip. Battery age and temperature can further influence the result, so a single efficiency figure should be tied to its stated conditions.
Power capability and energy efficiency should also remain separate. C-rate describes current relative to a battery’s rated capacity. A system may deliver the required power while showing a different RTE under that operating load.
Which Efficiency Figures Should Buyers Compare?
Before comparing quotations, identify what each supplier’s figure measures. Ask whether the stated efficiency refers to cells, a battery pack, the PCS, or the complete system. Check whether it is DC-to-DC or AC-to-AC, the power level used during testing, the SOC range, the duration of any standby period, and whether auxiliary loads and transformers are included.
A clear test boundary is more useful than a headline percentage without conditions. The Protocol for Uniformly Measuring and Expressing the Performance of Energy Storage Systems provides a technical basis for describing ESS performance consistently.
Peak conversion efficiency describes one operating point; RTE reflects energy across a full charge-discharge cycle. Neither figure alone describes usable energy, power limits, lifetime, or operating cost.
How Does an Integrated ESS Handle These Losses?
A commercial energy storage system brings the battery, PCS, BMS, EMS, thermal management, and protection equipment together. These components serve different purposes, but their combined behavior determines the energy exchanged at the system boundary. Monitoring can help operators review power flows and identify abnormal consumption, while thermal controls keep the battery within its intended operating range.
For broader commercial and industrial storage options, Sunway provides a starting point for reviewing the company’s energy storage portfolio.
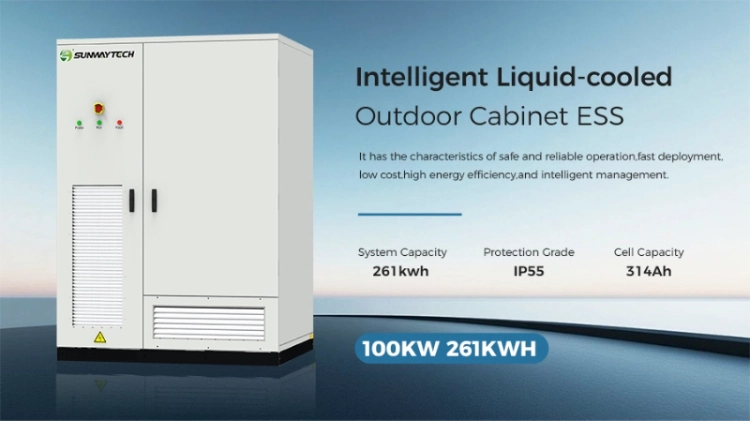
The SUNWAY 100kW 261kWh ESS is an example of an integrated C&I system. Its specifications list a 261 kWh LFP battery, modular PCS architecture, EMS and BMS, intelligent liquid cooling, 100 kW rated PV input, and 125 kW rated AC power. These ratings describe capacity and power, not round-trip efficiency.
Buyers comparing system configurations can review the C&I ESS product range before specifying the required battery capacity, power rating, and control functions.
The product page does not publish a verified AC-to-AC RTE figure. Its capacity, rated output, and cooling configuration should therefore not be used to infer a fixed efficiency percentage. A project-specific comparison requires a defined measurement boundary and operating profile.
Compare Efficiency on the Same Basis
When assessing a battery storage system, start by asking where energy is measured and which loads are included. Then compare the same cycle duration, power level, SOC window, and auxiliary-load treatment across the options. This makes the difference between cell performance and installed-system performance visible.
For a project-specific review of the intended power level, charging and discharging schedule, measurement boundary, and standby requirements, request a technical consultation with Sunway. A clearly defined test basis helps align the proposed system with the project’s energy requirements without relying on an efficiency percentage that cannot be compared like for like.
For a related explanation of how the usable energy window differs from round-trip efficiency, read the guide to SOC and depth of discharge.
FAQs
Q: What is battery round-trip efficiency?
A: It is the energy discharged divided by the energy used to charge the system, expressed as a percentage. The measurement boundary must be stated because DC-to-DC and AC-to-AC tests include different components and losses.
Q: Why is battery output lower than input?
A: Energy is lost through cell resistance, power conversion, wiring, transformers, and auxiliary equipment. Standby consumption and the duration between charging and discharging can also reduce net output when they are included in the test.
Q: Does a higher PCS efficiency mean a higher system RTE?
A: Not necessarily. PCS efficiency covers a conversion stage under defined conditions. Whole-system round-trip efficiency may also include battery losses, transformers, cooling, controls, and standby power, depending on the measurement boundary.